Overview
2025 Summer
Have you ever felt like your money was scattered across too many places? Robinhood here, Schwab there, Fidelity, Chase, Empower, HSBC… six or seven different brokerages in total. Every quarter, I wanted one simple thing: a clean pie chart showing my total asset allocation across everything. Instead, to achieve that right now, I have to do hours of manual work, entering each ETF holdings to a Google Sheets by hand, and the creeping feeling that I must have made a mistake somewhere.
And yes, I know what you’re thinking: “Isn’t there software for that?” There is. Plenty of fintech apps will happily connect to your accounts through Plaid. But two problems kept coming up:
- Not all accounts support Plaid. HSBC, for example, just doesn’t work.
- Even when it works, they don’t merge equivalent assets. VOO, Schwab’s S&P 500 mutual fund, and Fidelity’s S&P 500 fund are essentially the same thing under the hood—but these apps would display them separately, giving me a distorted view of my allocation.
So for years, I brute-forced it. Manually typing balances into a spreadsheet every quarter. Exhausting. Error-prone. But at least I got the full picture.
This time, I wondered: what if I didn’t? What if I built my own tool instead?
Why Not Plaid?
Naturally, I first looked at Plaid. But I ran into two walls almost immediately:
- Coverage gaps. Accounts like HSBC simply don’t support it.
- Access friction. To use Plaid (or similar APIs), you need to go through a lengthy developer review process. Alternatively, you’ll need to figure out custom APIs for each bank individually. Do I really want to reverse-engineer HSBC’s API just to see my own balance? Not really.
That’s when I realized: Since I don’t need real-time integrations, why don’t I do it the dumb way… with screenshots?
The Dumb but Effective Hack
So I built the simplest pipeline possible:
- Screenshots. Log into each brokerage and screenshot my holdings.
- Vision model. Feed those screenshots into Qwen2.5-VL running locally on Ollama. This parses each screenshot into structured JSON:
{
  "as_of_date": "2025-07-08",
  "broker": "ETRADE",
  "source_image": "Etrade Screenshot 2025-07-08.png",
  "holdings": [
    {
      "ticker": "AAPL",
      "name": "Apple Inc.",
      "equity": 12345.67
    }
  ]
}
At first, I considered a classic OCR approach: extract the raw text from each screenshot, then pass that text into an LLM for parsing. But Plain OCR loses positional information — it just dumps words and numbers without any sense of alignment, which makes mapping tickers to equity values unreliable. More advanced OCR systems like Tesseract can preserve bounding boxes and some structure — but I’d still need to engineer custom logic to rebuild tables from coordinates. And because every brokerage website has a slightly different layout, that would mean maintaining an ever-growing set of brittle, special-case rules.
With a vision-language model like Qwen2.5-VL, I don’t need to hardcode those rules. The model understands how items are arranged on the screen, and is flexible to adapt to different UIs. On top of that, it’s promptable, so I could correct mistakes with simple instructions. For example, many broker UIs show a ticker, then the day’s percent change in green or red, and finally the equity balance. The first time I ran the model, it confused the percent change for my total equity. The fix? In the system prompt, I just told it: “If you see a number inside a green or red circle, that’s a daily change. Ignore it.”
That tiny adjustment was enough. Suddenly the model stopped mixing up the numbers and pulled the right equity every time. That kind of flexible, promptable behavior is something traditional OCR simply can’t do.
By the end of this step, I had a folder of JSON snapshots — one per brokerage.
From JSONs to a Unified View
The next step was merging everything into a single CSV and building a web app on top. Here’s the flow:
- Combine all JSON snapshots into one CSV.
- Pass each ticker into a local LLM (also running on Ollama) to map it into an asset category.
- Cache those mappings so equivalent funds collapse into the same bucket.
Example of the cache file:
{
  "VG INST 500 IDX": {
    "category": "S&P 500"
  },
  "SWPPX||Schwab S&P 500 Index Fund": {
    "category": "S&P 500"
  }
}
So even if different brokerages report different tickers or mutual fund names, they roll up into the right category.
Finally, the web app renders everything as an interactive UI: a clean pie chart showing exactly how much of my money is in U.S. equities, international equities, bonds, etc.
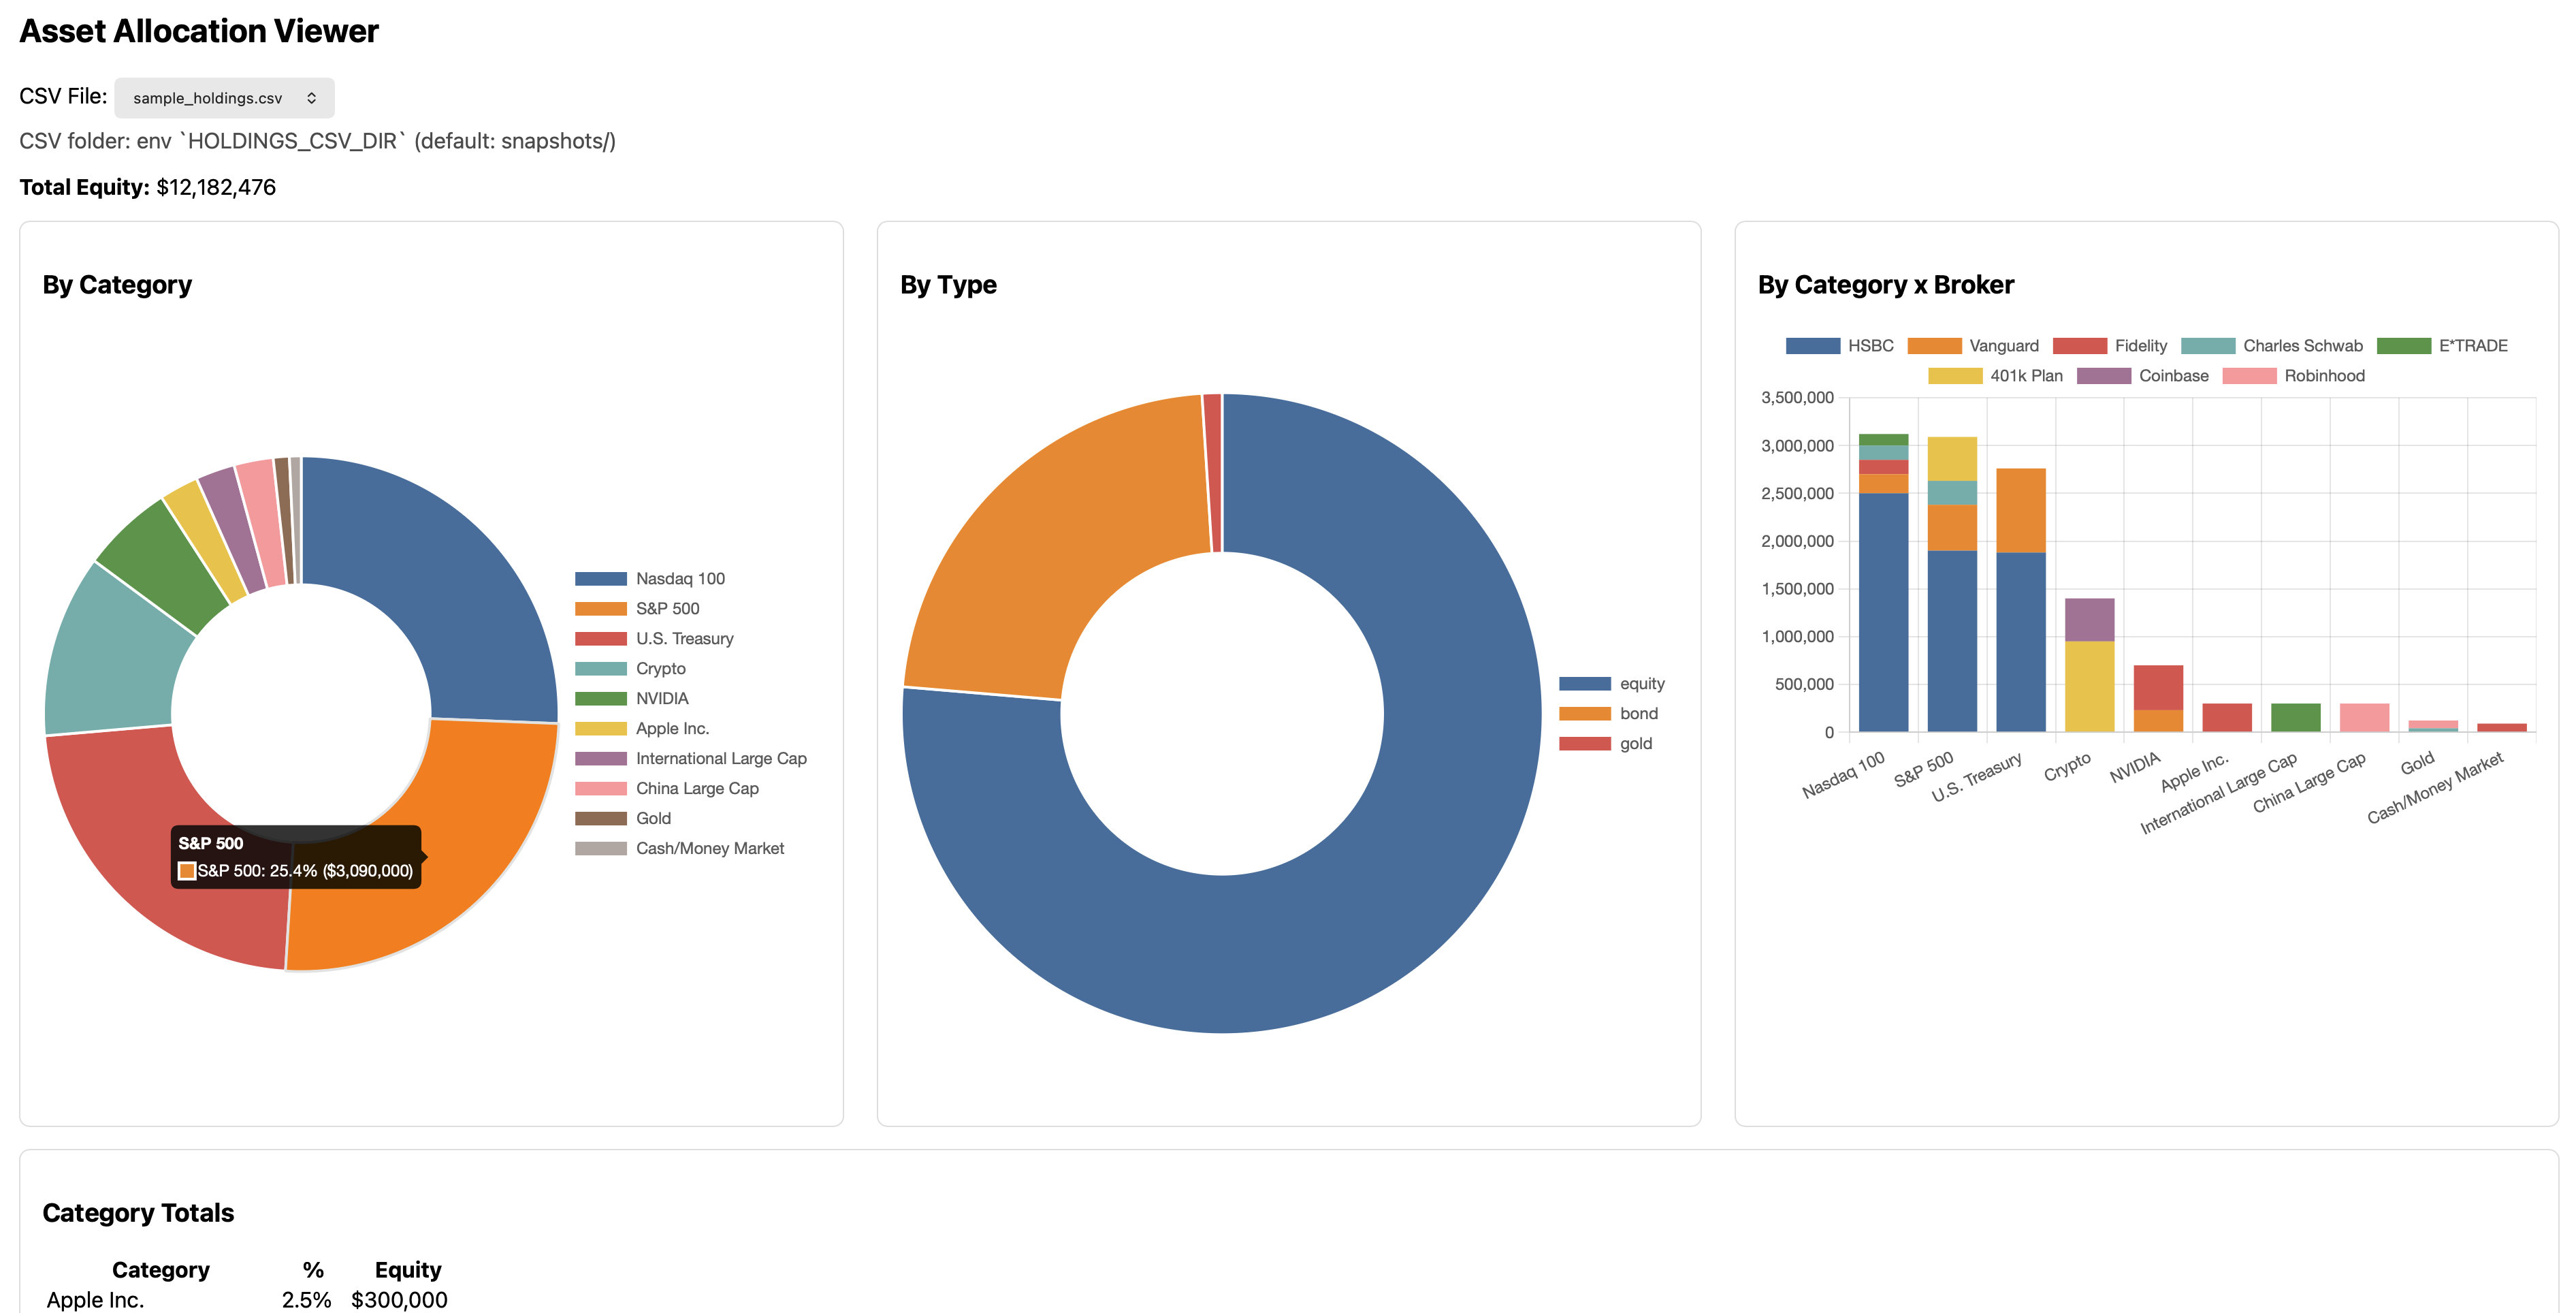
Interactive web view with sample data.
For the first time, I had a true, consolidated view of my portfolio across every account.
Evaluation and Accuracy
For my first round of testing, I kept things simple: I manually inspected every entry the model parsed. The results were surprisingly strong. Out of all my holdings, the model got every single number correct except for one — and it was a funny edge case.
I had exactly $5.22 of NVIDIA stock, a leftover referral reward from Robinhood. Every other position in my portfolio was in the tens of thousands, but this one tiny holding threw the model off. It saw the “5.22…” and confidently reported that I had $5,220 worth of NVIDIA stock. Not the end of the world, but definitely wrong. My solution was the laziest (and most satisfying) one: I just sold the $5 worth of NVIDIA stock to remove the ambiguity entirely (and pay Uncle Sam the short term capital gain tax on that $0.22).
Other than that, the accuracy was near-perfect. Still, I don’t want to rely forever on manual inspection. If I had more time, I’d love to make the evaluation more robust. One idea: use OCR as a ground truth checker. OCR by itself isn’t great for parsing structured data, but it’s usually quite good at faithfully extracting raw text. I could use OCR to generate a text-only dump of the screenshot, then test whether the values the vision model reports actually exist in that dump. If they match, I can trust the result; if not, I can flag the discrepancy for review.
That kind of hybrid approach — vision model for structure, OCR for verification — feels like the best path toward building a reliable system long-term.
Another evaluation method I thought about is backtesting against my old manual entries. For the past few years, I’ve been typing numbers into spreadsheets by hand. If I had also saved screenshots from those same periods, I could now feed them through this pipeline and compare the results directly against my “ground truth” manual data. That would give me a way to validate accuracy over time. Unfortunately, I don’t have those old screenshots — but if I had, it would’ve been the perfect dataset for testing how reliable this system really is.
Main Takeaways
-
LLMs make “dumb” hacks powerful. Traditional OCR would’ve choked on brokerage screenshots. Qwen2.5-VL + a well-written prompt gave me structured JSON with minimal cleanup. And running a local LLM with Ollama meant all sensitive financial data stayed on my machine — huge peace of mind compared to shipping it off to some third-party API.
-
Be a builder, not just a user. For years I lived with apps that almost worked. It turned out it was faster to build my own tool than to keep waiting for someone else to add the feature I needed.
-
Extendability matters. What I built isn’t an app, it’s just a feature. But it’s the feature I needed. Existing fintech apps (Copilot, Empower, Interactive Brokers) aren’t easily modifiable, which forced me to roll my own. I dream of a future where adding features feels as simple as saying, “Hey ChatGPT, can you merge equivalent ETFs in my dashboard?” and a new tab appears like magic.
Future Work
The current flow still requires me to manually log in and take screenshots. In the future, I’d like to automate that step too. Tools like PyAutoGUI (or similar automation packages) could handle the repetitive work of logging into each brokerage, navigating to the holdings page, and capturing a screenshot. On macOS, 2FA text messages can autofill into the browser, which means even two-factor authentication could be automated. With that in place, the entire pipeline — from login to pie chart — could run with a single command.
Under the Hood
The entire pipeline — from screenshot → JSON → web app — was coded by Codex with me steering.
- Python 3.9+ powers a small CLI and modules.
- Screenshot parsing uses a local Ollama server with Qwen2.5-VL for vision and a lightweight text model (llama3.1:8b) for asset categorization.
- A Flask 3 app serves a single inlined template and uses Chart.js for pie and stacked charts.
- Data is persisted locally as JSON and CSV.
- Networking uses only the Python standard library (
urllib) — no external HTTP dependencies.
The whole thing is light enough to run on my laptop, but powerful enough to give me a consolidated financial view I’d been missing for years.